banner

無料かつオンラインで統計ビデオを作成する

ビデオを通じて統計を表示することは、データと観点を視覚的に提示する最も直接的な方法です。FlexClipのオンライン統計ビデオメーカーは、共有に値する統計ビデオを作成するために必要なすべてを提供し、プロセスを簡単にします。プロのテンプレート、豊富なメディアストック、有効的な編集ツールなどから選択し、説得力のある統計ビデオを自由に作成できます。ぜひ無料でお試しください!

無料動画を作る
  • 便利なビデオエディタicon便利なビデオエディタ
  • リッチな動画テンプレートiconリッチな動画テンプレート
  • 豊富なメディアライブラリicon豊富なメディアライブラリ
  • ダイナミックなテキストアニメーションiconダイナミックなテキストアニメーション
  • Trusted by:
  • microsoft-logo
  • google-logo
  • dropbox-logo
  • youtube-logo
  • unsplash-logo
  • storyblocks-logo

無料で使えるプロな統計ビデオテンプレート

  • 現代の会社レポートのサンプル
    カスタマイズ
    AI再生成

    現代の会社レポートのサンプル

  • リサーチレポートプレゼンテーション
    カスタマイズ
    AI再生成

    リサーチレポートプレゼンテーション

  • 事業報告書
    カスタマイズ
    AI再生成

    事業報告書

  • プロの年次会社レポート ビジネス ビデオ
    カスタマイズ
    AI再生成

    プロの年次会社レポート ビジネス ビデオ

  • ビジネスシンプルプロジェクトレポート
    カスタマイズ
    AI再生成

    ビジネスシンプルプロジェクトレポート

  • 第1四半期レポート
    カスタマイズ
    AI再生成

    第1四半期レポート

  • ワールドカップサッカー試合チームPKのYouTubeイントロ
    カスタマイズ
    AI再生成

    ワールドカップサッカー試合チームPKのYouTubeイントロ

  • テック スタイル ビッグデータ インパクト リストクル
    カスタマイズ
    AI再生成

    テック スタイル ビッグデータ インパクト リストクル

  • 法人事業年次報告書
    カスタマイズ
    AI再生成

    法人事業年次報告書

  • 青オレンジ 3 d ビジネス レポート
    カスタマイズ
    AI再生成

    青オレンジ 3 d ビジネス レポート

  • ビジネス四半期レポート プレゼンテーション
    カスタマイズ
    AI再生成

    ビジネス四半期レポート プレゼンテーション

  • 売上報告書
    カスタマイズ
    AI再生成

    売上報告書

無料編集用の統計ビデオ
Financial Data Comparison And Analysis Research
Economic inflation rise in interest rates financial graph percentage statistics
Close up of business woman holding clipboard with graphics and financial statistics working overtime in front of computer sitting in start-up business office. Busy employee using modern technology
3D animation of growing histogram. Hi tech charts with grid. Digital display with stock market charts. Camera movement with depth of field
Big data statistic patterns and trends cloud computing analysis graphs and chart
Neon Purple Grid Pattern with Dynamic Circular Data Visualization and Futuristic Interface Design
Chart with upward-pointing bars indicating sequential growth
Statistical graph with business finance concept, 3d rendering.
business, corporate and people concept - businessman and businesswomen with charts at office meeting
Portrait of African American brokerage company specialist wearing headset holding papers walking back and forth in office discussing stock trading issues on phone late in evening
Visual representation of data as a bar chart stamped onto paper
Quantum Volume Benchmark Panel With Wireframe Cube And Score
Business concept where likable confident positive professional international team of specialists consulting about economic indicators depikted on tv screen in evening office
Financial dashboard showing Shorts market data
Female chief analyst holding meeting with four businesswmen showing digital interactive whiteboard with charts, data and statistics at briefing table in office
Data Flow Following Arrow Showing Global Financial Business Network Charts
Graphs and Charts
Business graphs and charts
Graph chart diagram
Seamless pattern background with dollar signs. animation. small, black dollar signs slowly blink on grid. Perfect to use in presentation. Can put your text, charts, graphs in it.
Graph chart diagram
Professional is engaged in planning working with charts and graphs
statistics infographic bars data animation
Mentioning demographic shift in media headlines

なぜ統計ビデオを作成する必要があるのか?

  • Promo Video

    売り上げを伸ばす

    訴求力のある動画は、ユーザーの購買行動に強く影響を与え、売上に結びつきます。

  • Promo Video

    トラフィックを増やす

    あなたのサイトへのトラフィックを促進するためには、動画コンテンツの力に勝るものはありません。

  • Promo Video

    ソーシャルシェアにおすすめ

    ソーシャルメディアプラットフォーム上の動画は、画像とテキストを組み合わせたものよりも多くの「いいね!」や「シェア」を生み出します。

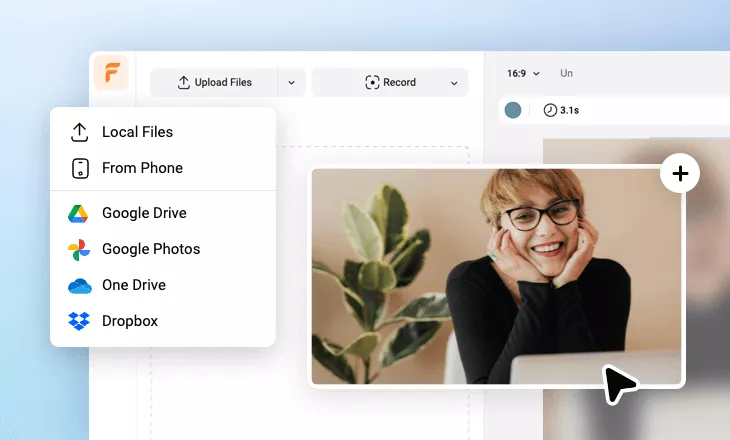
統計ビデオを作成する三つのステップ

  1. 1

    メディアの追加

    コンピュータライブラリやストックライブラリからビデオや写真をストーリーボードに追加します。

  2. 2

    カスタマイズ

    テキスト、音楽、ナレーションを追加して、あなたの統計ビデオをカスタマイズすることができます。

  3. 3

    輸出

    あなたの統計ビデオを様々な比率や定義でダウンロードしたり、オンラインで世界と共有したりすることができます。
統計ビデオを作成する三つのステップ

関連テーマ

Editor thumbnail
統計ビデオを無料且つ数分間で作成する。
無料動画を作る